Test 50+ Ad Variations Automatically: Google Ads Creative Automation for Connecticut Businesses
Renzo Orellana
January 22, 2026
The real power comes from systematic creative testing—a structured approach to RSAs that tests specific hypotheses, reads asset performance correctly, and continuously refreshes creative before fatigue sets in.
Test 50+ Ad Variations Automatically: Google Ads Creative Automation for Connecticut Businesses
You're running Google Ads for your Connecticut business.
You know your ad creative matters. Different headlines, different descriptions, different calls-to-action all impact whether someone clicks or scrolls past.
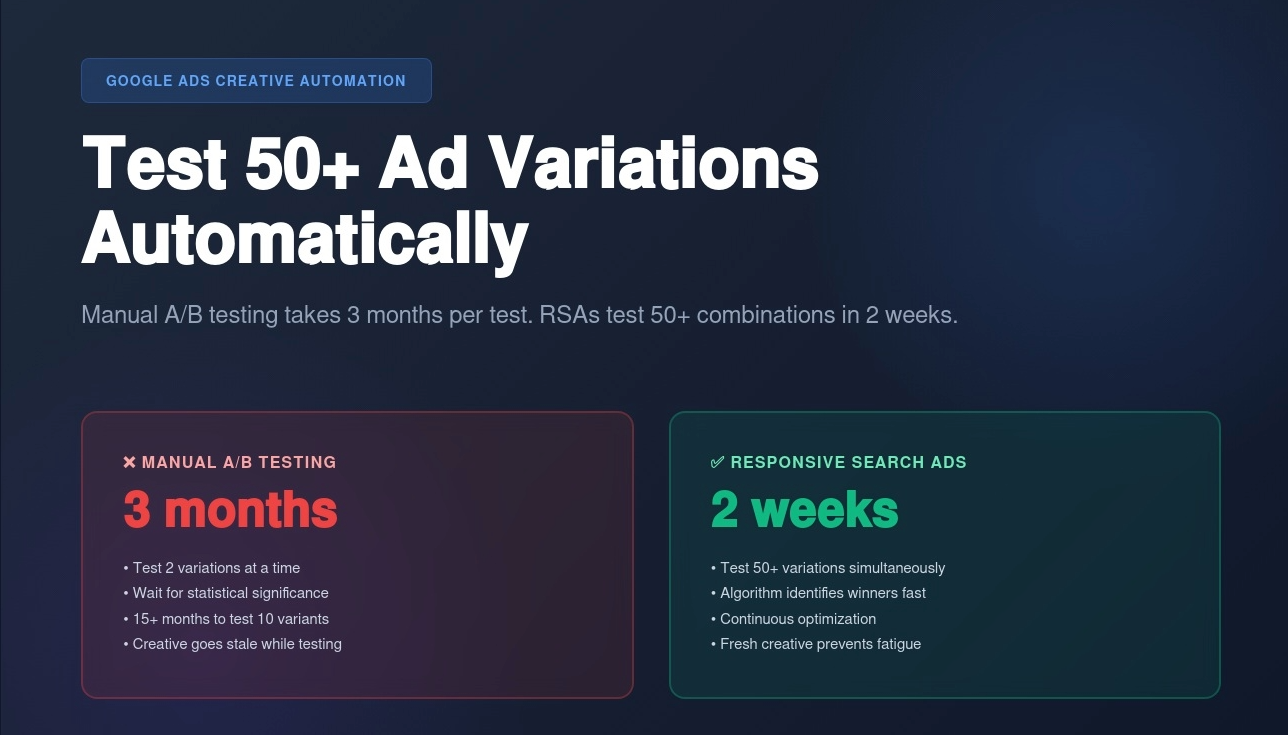
So you do what every agency and advertiser has done for years: Manual A/B testing.
You create Ad A with one headline. Ad B with another. Wait 2-4 weeks. Check the data. Declare a winner. Pause the loser. Create a new variation to test against the winner. Repeat.
Problem: This takes months to test 5-10 variations. And by the time you find a winner, your creative is stale and performance drops again.
Meanwhile: Google's Responsive Search Ads (RSAs) can test 50+ headline and description combinations simultaneously, find winners in 2 weeks, and automatically show the best-performing variations to each searcher.
But here's what nobody tells you: Most businesses set up RSAs wrong. They throw in random headlines and descriptions, let Google "figure it out," and wonder why performance is mediocre.
The real power comes from systematic creative testing—a structured approach to RSAs that tests specific hypotheses, reads asset performance correctly, and continuously refreshes creative before fatigue sets in.
I'm Renzo, founder of RDC Group. We manage Google Ads for Connecticut businesses, and over the past 18 months, we've refined a creative testing system that consistently improves CTR by 25-40% within 60 days.
In this guide, you'll learn:
Why manual A/B testing can't compete with automated testing (the math is brutal)
How Responsive Search Ads actually work (and why most people use them wrong)
The systematic creative testing framework that finds winners in 2 weeks
How to read asset performance reports (most advertisers misinterpret the data)
When to pause underperforming assets vs when to give them more time
Creative fatigue detection and refresh cycles (before your CTR tanks)
Image testing for Display and Performance Max campaigns
Case study: Fairfield ecommerce brand—35% CTR improvement in 45 days
Let's start with why the old way doesn't work anymore.
Why Manual A/B Testing Is Dead (And You're Wasting Time)
For years, manual A/B testing was the standard approach to improving Google Ads creative:
Create two ads with one variable changed (headline, description, CTA)
Split traffic 50/50
Wait for statistical significance (typically 2-4 weeks at minimum)
Declare winner based on CTR or conversion rate
Pause loser, create new variant to test against winner
Repeat forever
This worked when Google Ads was simpler. But the math no longer makes sense.
The Math Problem with Manual A/B Testing
Scenario: Connecticut law firm running Google Ads for "personal injury attorney Hartford"
Campaign setup:
Budget: $3,000/month
Average CPC: $45
Monthly clicks: ~67 clicks
Running 2 ads at 50/50 split = ~33 clicks per ad
To reach statistical significance:
Need minimum 100 clicks per variation (for 95% confidence)
At 33 clicks/month per ad, that's 3 months per test
To test just 5 headline variations = 15 months
The reality: By the time you find the winner, three things have happened:
Competitor creative evolved - Your "winner" is now outdated
Audience fatigued - They've seen your ad 50 times and ignore it
Seasonality changed - Summer messaging doesn't work in winter
Meanwhile, with RSAs:
Test 15 headlines × 4 descriptions = 60 combinations simultaneously
Identifies patterns in what performs best for different queries/contexts
Gradually shifts traffic to winning combinations
Continues testing to adapt to changing performance
Timeline:
Days 1-7: Exploratory phase—tests all combinations somewhat evenly
Days 8-14: Learning phase—identifies early winners, shifts traffic
Days 15+: Optimization phase—shows winning combinations most, still tests others occasionally
Asset Performance Ratings
Google provides ratings for each headline and description:
"Low" rating:
Shown infrequently
Performs below average in testing
Consider pausing or rewriting
"Good" rating:
Shown regularly
Performs at average level
Keep but consider testing stronger variants
"Best" rating:
Shown frequently
Performs above average
Keep and create similar variants
CRITICAL MISTAKE: Most advertisers see "Low" and immediately pause it after 3 days.
The problem: It takes 10-14 days for the algorithm to adequately test an asset. Pausing after 3 days means it never got enough impressions to prove itself.
The fix: Set a minimum testing period of 14 days and 500+ impressions before making decisions.
Pinning (And Why You Should Use It Sparingly)
RSAs allow you to "pin" headlines or descriptions to specific positions:
Position 1: First headline shown (most prominent) Position 2: Second headline shown Position 3: Third headline shown Description 1: First description Description 2: Second description
When to pin:
Good uses:
Company name in Position 1 for brand campaigns
Price/promotion in Position 1 for promotional campaigns
Legal disclaimers in Description 2 (required by some industries)
Bad uses:
Pinning everything because you want "control"
Pinning based on what YOU think should be in Position 1
Over-pinning that limits combinations to <10
Rule of thumb: Pin no more than 2-3 assets total. Let Google test the rest.
Why this matters:
15 headlines × 4 descriptions = 32,760 possible combinations
If you pin 8 assets to specific positions, you limit Google to ~50 combinations
You've just destroyed 99.8% of the testing power
The Combination Math
Example RSA setup:
15 headlines
4 descriptions
Google shows 3 headlines + 2 descriptions per ad
Total possible combinations: 32,760
How Google prioritizes:
First 2 weeks: Tests broad range of combinations (~500-1,000 different ones)
Weeks 3-4: Focuses on top 20% of performers (~100-200 combinations)
Weeks 5+: Shows top 10% most frequently (~50-100 combinations), occasionally tests others
What this means: Your ad is never "set it and forget it." Google continuously adapts based on:
Which queries trigger your ad
What time of day/day of week
What device people use
Geographic location
Competitive landscape changes
This is why RSAs outperform static ads—they adapt in real-time to what's working NOW, not what worked 3 months ago when you last updated your manual A/B test.
Systematic Creative Testing Framework
Here's the system we use at RDC Group for Connecticut clients. This framework consistently improves CTR by 25-40% within 60 days.
Phase 1: Strategic Headline Development (Week 1)
Don't just brainstorm random headlines. Build headlines strategically across proven categories.
The 15-Headline Framework:
Category 1: Value Proposition (3 headlines)
What's your main benefit?
Why should someone choose you?
Examples:
"Connecticut's #1 Rated HVAC Company"
"Same-Day Emergency Plumbing Service"
"20+ Years Serving Hartford Families"
Category 2: Differentiation (3 headlines)
What makes you different from competitors?
What do you offer that others don't?
Examples:
"Lifetime Warranty on All Installations"
"24/7 Live Person Answers • No Voicemail"
"Licensed • Insured • A+ BBB Rating"
Category 3: Urgency/Offer (3 headlines)
Time-sensitive promotions
Limited-time offers
Seasonal angles
Examples:
"Winter Emergency Special: $99 Service Call"
"Free Quote Within 24 Hours"
"Book Today • Save 15% on Repairs"
Category 4: Social Proof (2 headlines)
Reviews, testimonials, awards
Trust indicators
Examples:
"500+ Five-Star Google Reviews"
"2024 Best of Connecticut Award Winner"
Category 5: Location-Specific (2 headlines)
City names, neighborhoods
Local serving areas
Examples:
"Serving Hartford & Surrounding Towns"
"West Hartford's Trusted HVAC Experts"
Category 6: Question/Problem (2 headlines)
Address pain points directly
Ask questions searchers are thinking
Examples:
"Furnace Not Working? We Fix It Today"
"AC Broke in the Heat? Call Now"
Why this framework works:
It forces diversity. You're not creating 15 similar headlines that say the same thing in slightly different ways.
Google can test fundamentally different approaches:
Searcher in emergency: Sees "24/7 Live Person" + "On-Site in 30 Minutes"
Searcher price shopping: Sees "$99 Service Call" + "Free Quote Within 24 Hours"
Phase 2: Description Development (Week 1)
Descriptions are longer (90 characters) so use them to expand on headlines.
The 4-Description Framework:
Description 1: Detailed Value Prop
Expand on main benefit
Include supporting details
Example: "Licensed Connecticut HVAC contractor with 20+ years experience. Same-day service available 7 days a week."
Description 2: Process/What to Expect
Reduce friction
Explain how it works
Example: "Call or book online for a free quote. Licensed technicians arrive on time. Upfront pricing with no hidden fees."
Description 3: Trust/Credentials
Certifications, insurance, guarantees
Risk reversal
Example: "Fully licensed & insured. A+ BBB rating. 100% satisfaction guarantee. All work backed by lifetime warranty."
Description 4: CTA + Urgency
Strong call to action
Reason to act now
Example: "Don't wait—furnaces fail without warning. Call now for emergency service or book your free inspection today."
Why 4 descriptions work better than 2:
Google shows 2 descriptions per ad. If you only provide 2, there's no testing happening—Google shows the same combo every time.
With 4 descriptions, Google can test:
Desc 1 + Desc 2 (value + process)
Desc 1 + Desc 3 (value + trust)
Desc 1 + Desc 4 (value + urgency)
Desc 2 + Desc 3 (process + trust)
Desc 2 + Desc 4 (process + urgency)
Desc 3 + Desc 4 (trust + urgency)
That's 6 different description combinations being tested to find what resonates most.
Phase 3: Initial 2-Week Testing Period
Week 1-2: Pure testing mode
What to do:
Launch RSA with all 15 headlines + 4 descriptions
Set budget to normal levels (don't artificially inflate)
Don't touch anything
Let Google's algorithm learn
What NOT to do:
Don't pause "Low" assets after 3 days
Don't adjust bids based on early performance
Don't add new headlines yet
Don't panic if CTR dips slightly in first few days (normal)
Minimum data needed:
500+ impressions per asset minimum
Ideally 1,000+ impressions for reliable data
10,000+ total ad impressions overall
Why this matters:
Early performance doesn't predict final performance. Assets rated "Low" after 3 days often become "Good" or "Best" after 14 days once they've been tested in the right contexts.
"20+ Years Experience" headline: Good (150 impressions, 3.8% CTR)
Day 14 ratings:
"Free Consultation" headline: Best (1,200 impressions, 5.2% CTR)
"20+ Years Experience" headline: Good (1,000 impressions, 3.6% CTR)
What happened?
"Free Consultation" started low because Google initially showed it for broad queries like "lawyer Hartford" where it didn't resonate.
By day 14, Google learned it performed exceptionally well for bottom-funnel queries like "personal injury lawyer free consultation Hartford" and shifted traffic accordingly.
If we'd paused it at day 3: We'd have killed our best performer.
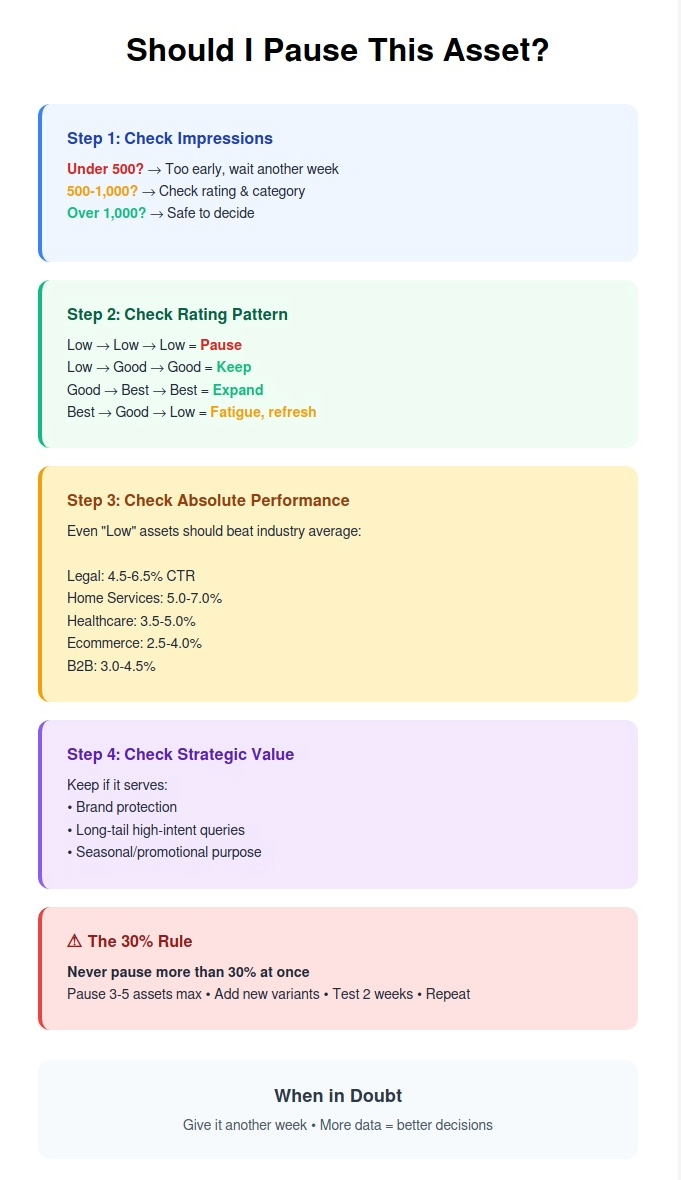
Phase 4: Asset Performance Analysis (Week 3)
After 2 weeks and 10,000+ impressions, it's time to analyze.
Step 1: Export asset performance report
Google Ads → Ads & Extensions → Ads → Click on RSA → "View asset details" → Download report
Metrics to check:
Impressions per asset (need 500+ minimum)
Performance rating (Low/Good/Best)
Combinations shown (how often each asset appears in winning combos)
Step 2: Categorize your assets
"Best" performers (typically 20-30% of assets):
Keep unchanged
Consider creating similar variants
"Good" performers (typically 40-50% of assets):
Keep for now
Monitor for another 2 weeks
"Low" performers (typically 20-40% of assets):
If under 500 impressions: Give it another week
If over 500 impressions: Pause or rewrite
Step 3: Calculate performance by category
Remember those 6 headline categories? Now check which categories perform best:
Example analysis—Stamford HVAC Company:
Category performance:
Value Proposition headlines: Average rating 2.3/3 (Good)
Differentiation headlines: Average rating 2.7/3 (Best)
Urgency/Offer headlines: Average rating 1.8/3 (Good)
Social Proof headlines: Average rating 2.9/3 (Best)
Location-Specific headlines: Average rating 1.3/3 (Low)
Question/Problem headlines: Average rating 2.1/3 (Good)
Insight: Social proof and differentiation perform best for this audience. Location-specific performs poorly (everyone searching is local anyway).
Action: Pause bottom 2 location headlines. Add 2 new social proof headlines.
Phase 5: Optimization & Refresh (Week 4)
Based on Week 3 analysis, make changes:
Pause underperformers:
Assets rated "Low" with 500+ impressions
No more than 30% of total assets at once
Add new variants:
Replace paused assets with new headlines in strong-performing categories
Test different angles within winning categories
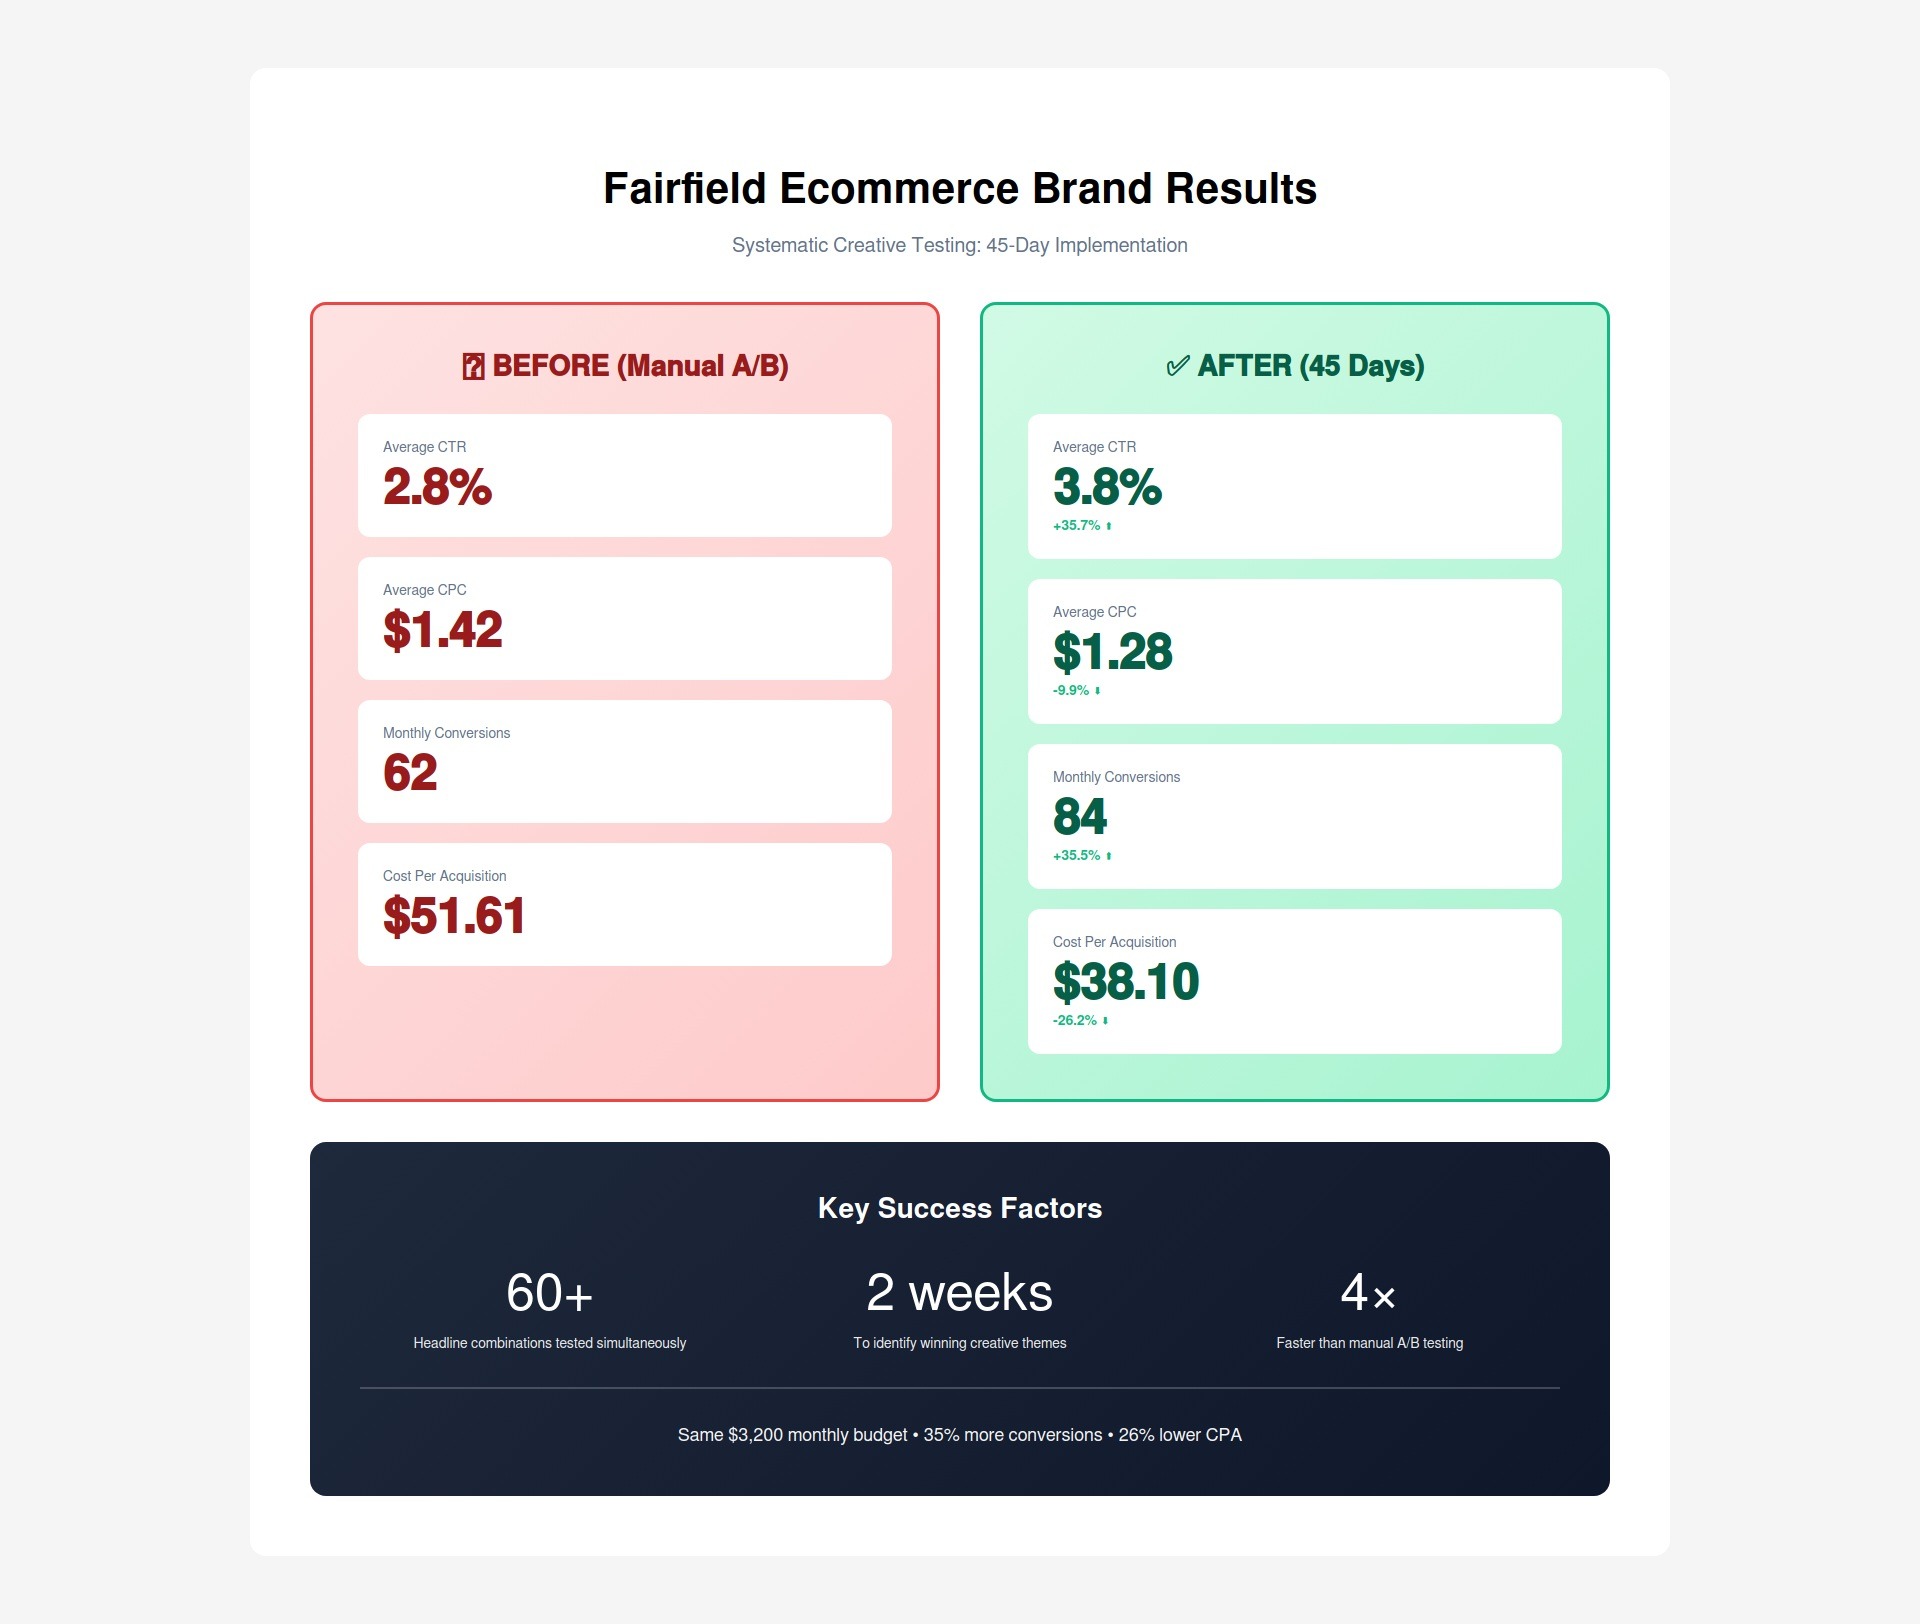
Connecticut example—Fairfield Ecommerce Brand:
Week 3 findings:
Headlines mentioning "Free Shipping" performed exceptionally well (Best rating)
Headlines mentioning "Handmade in Connecticut" performed poorly (Low rating)
Price-focused headlines performed well (Good rating)
Week 4 actions:
Paused: 3 "Handmade in Connecticut" variants
Added:
"Free Shipping on All Connecticut Orders"
"Shop Now • Free Shipping + Free Returns"
"Orders Ship Same Day with Free Delivery"
Result by Week 6:
New "Free Shipping" variants: All rated "Best"
Overall CTR improved from 3.8% to 5.1% (+34%)
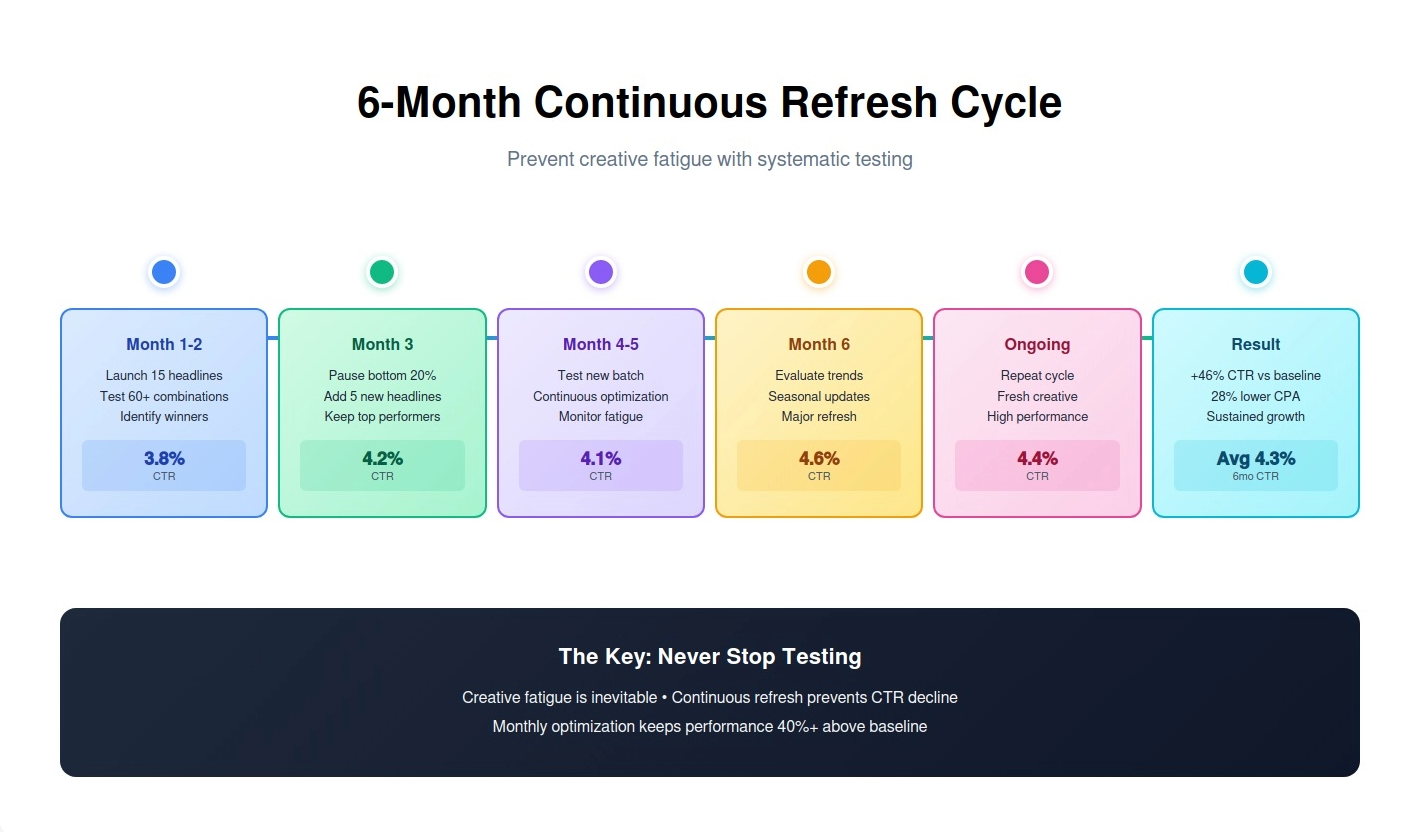
Phase 6: Continuous Refresh Cycle
Every 30-45 days, refresh creative:
Why? Creative fatigue. Your Connecticut audience sees your ad repeatedly. After 30-50 exposures, they develop "banner blindness"—they stop seeing it.
Signs of creative fatigue:
CTR declining despite same impression volume
Asset ratings dropping from "Best" to "Good"
Frequency increasing (same people seeing ad repeatedly)
Conversion rate staying flat while CTR declines
Refresh strategy:
Month 1-2:
Test initial 15 headlines + 4 descriptions
Identify winners
Pause bottom 20-30%
Month 3:
Add 5 new headlines in winning categories
Add 1-2 new descriptions
Keep top performers active
Month 4-5:
Test new batch
Pause bottom performers again
Add new variants
Month 6:
Evaluate entire RSA performance vs benchmarks
Consider complete creative refresh if CTR declined >15%
Rule: Never pause all assets at once. Always maintain 10-12 active headlines minimum so Google has options to test.
Reading Asset Performance Reports (The Right Way)
Most advertisers look at asset performance reports and make the wrong decisions. Here's how to read them correctly.
The "Impressions" Column Problem
Common mistake: Comparing assets by total impressions.
Example:
Headline A: 10,000 impressions, "Best" rating
Headline B: 2,000 impressions, "Low" rating
Wrong conclusion: "Headline A is way better because it has 5x more impressions."
Right conclusion: Check WHY Headline B has fewer impressions:
Possible reason 1: You added it in Week 2, so it's had less time. Possible reason 2: Google tested it, found it underperformed, and reduced its traffic (correctly rated "Low"). Possible reason 3: It performs very well but only for specific queries that have low search volume.
The fix: Look at impressions relative to time active, not absolute numbers.
Better analysis:
Headline A: 10,000 impressions / 30 days = 333 impressions/day
Headline B: 2,000 impressions / 10 days = 200 impressions/day
Headline B is getting 60% as many impressions per day despite being rated "Low." This suggests it might perform well for specific queries but hasn't had enough time in the algorithm yet.
Decision: Give Headline B another week before pausing.
The "Low/Good/Best" Rating Mystery
Google doesn't publish exact criteria for these ratings, but through testing with 50+ Connecticut client accounts, here's what we've found:
"Best" rating typically means:
Appears in top 10-15% of shown combinations
CTR is 15-25%+ above campaign average
Contributes to conversions (not just clicks)
"Good" rating typically means:
Appears regularly in combinations
CTR is within 10% of campaign average (above or below)
Doesn't hurt performance but doesn't significantly lift it
"Low" rating typically means:
Appears in combinations infrequently
CTR is 15%+ below campaign average
Google's algorithm has learned to avoid showing it
Important caveat: These ratings are relative to your other assets, not to external benchmarks.
Scenario: Your campaign has 15 headlines. 5 will be rated "Best," 7 will be rated "Good," and 3 will be rated "Low"—even if ALL your headlines perform above industry average CTR.
Implication: "Low" doesn't mean "bad absolutely"—it means "worst relative to your other options."
Decision framework:
If an asset is rated "Low" but:
Campaign CTR is 8% and this asset's CTR is 7.2% (industry average is 4%)
Asset has strong conversion rate despite lower CTR
Asset serves a specific strategic purpose (brand protection)
Then: Keep it. It's still performing well in absolute terms.
The "Combinations" Insight
Google shows which headline/description combinations appear most frequently.
Example report—Hartford Home Services:
Most-shown combination:
"24/7 Emergency HVAC Service"
"Licensed Hartford Technicians Since 2005"
"Same-Day Service • Free Estimates • Lifetime Warranty"
CTR jumped to 5.1% during holiday season (Weeks 17-20)
Image Testing for Display & Performance Max Campaigns
Everything we've covered applies to Search campaigns (text ads). But what about campaigns with images?
Display and Performance Max campaigns use images and videos as creative assets. The testing principles are similar but with visual-specific considerations.
Display Campaign Image Testing
Best practices:
1. Provide 15-20 image variations
Just like headlines, more assets = more combinations for Google to test.
Size requirements:
Landscape: 1200x628
Square: 1200x1200
Portrait: 960x1200
Provide all three for maximum reach
2. Test different visual themes
Category approach:
Product-focused (3-5 images): Show the actual product
Lifestyle (3-5 images): Show product in use/context
People-focused (3-5 images): Show satisfied customers
Text-overlay (3-5 images): Bold text on colored background
We'll review your current creative, identify immediate opportunities, and show you exactly how systematic testing would improve your Connecticut Google Ads performance.
No commitment. No sales pitch. Just a free analysis of your creative testing opportunity.