In this guide, you'll learn exactly how automated Meta Ads reporting works, what tools you need, and how Connecticut agencies are implementing this to free up their account managers for high-value work.
It's the 29th of the month. Your monthly client reporting is due tomorrow.
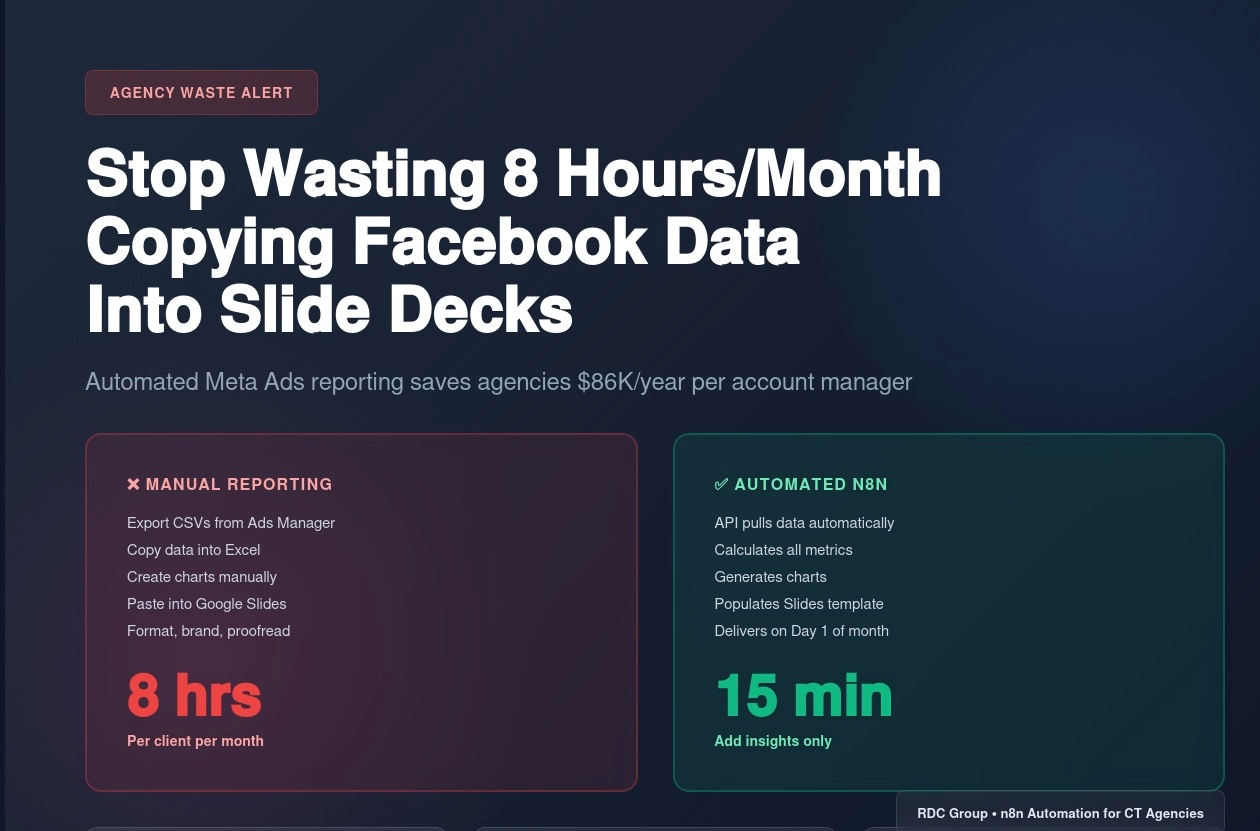
You open Facebook Ads Manager. Export campaign data to CSV. Copy numbers into Excel. Create charts. Take screenshots of top-performing ads. Paste everything into Google Slides. Format. Adjust colors. Add your agency branding. Write commentary. Repeat for 12 clients.
Total time: 8 hours.
Your hourly rate: $100.
Cost to your agency: $800/month per account manager.
For what? Copying numbers from one system into a prettier format.
And here's the brutal part: This happens every single month. That's $9,600 per year per account manager spent on manual data entry.
Meanwhile, your competitors automated this 6 months ago and reallocated those 96 hours/year to actually improving campaign performance.
I'm Renzo, founder of RDC Group. We build automation systems for Connecticut marketing agencies. Over the past year, we've helped 8 agencies eliminate manual Meta Ads reporting entirely using n8n workflows that auto-generate client reports.
Results:
In this guide, you'll learn exactly how automated Meta Ads reporting works, what tools you need, and how Connecticut agencies are implementing this to free up their account managers for high-value work.
Before we solve it, let's quantify what manual reporting actually costs your agency.
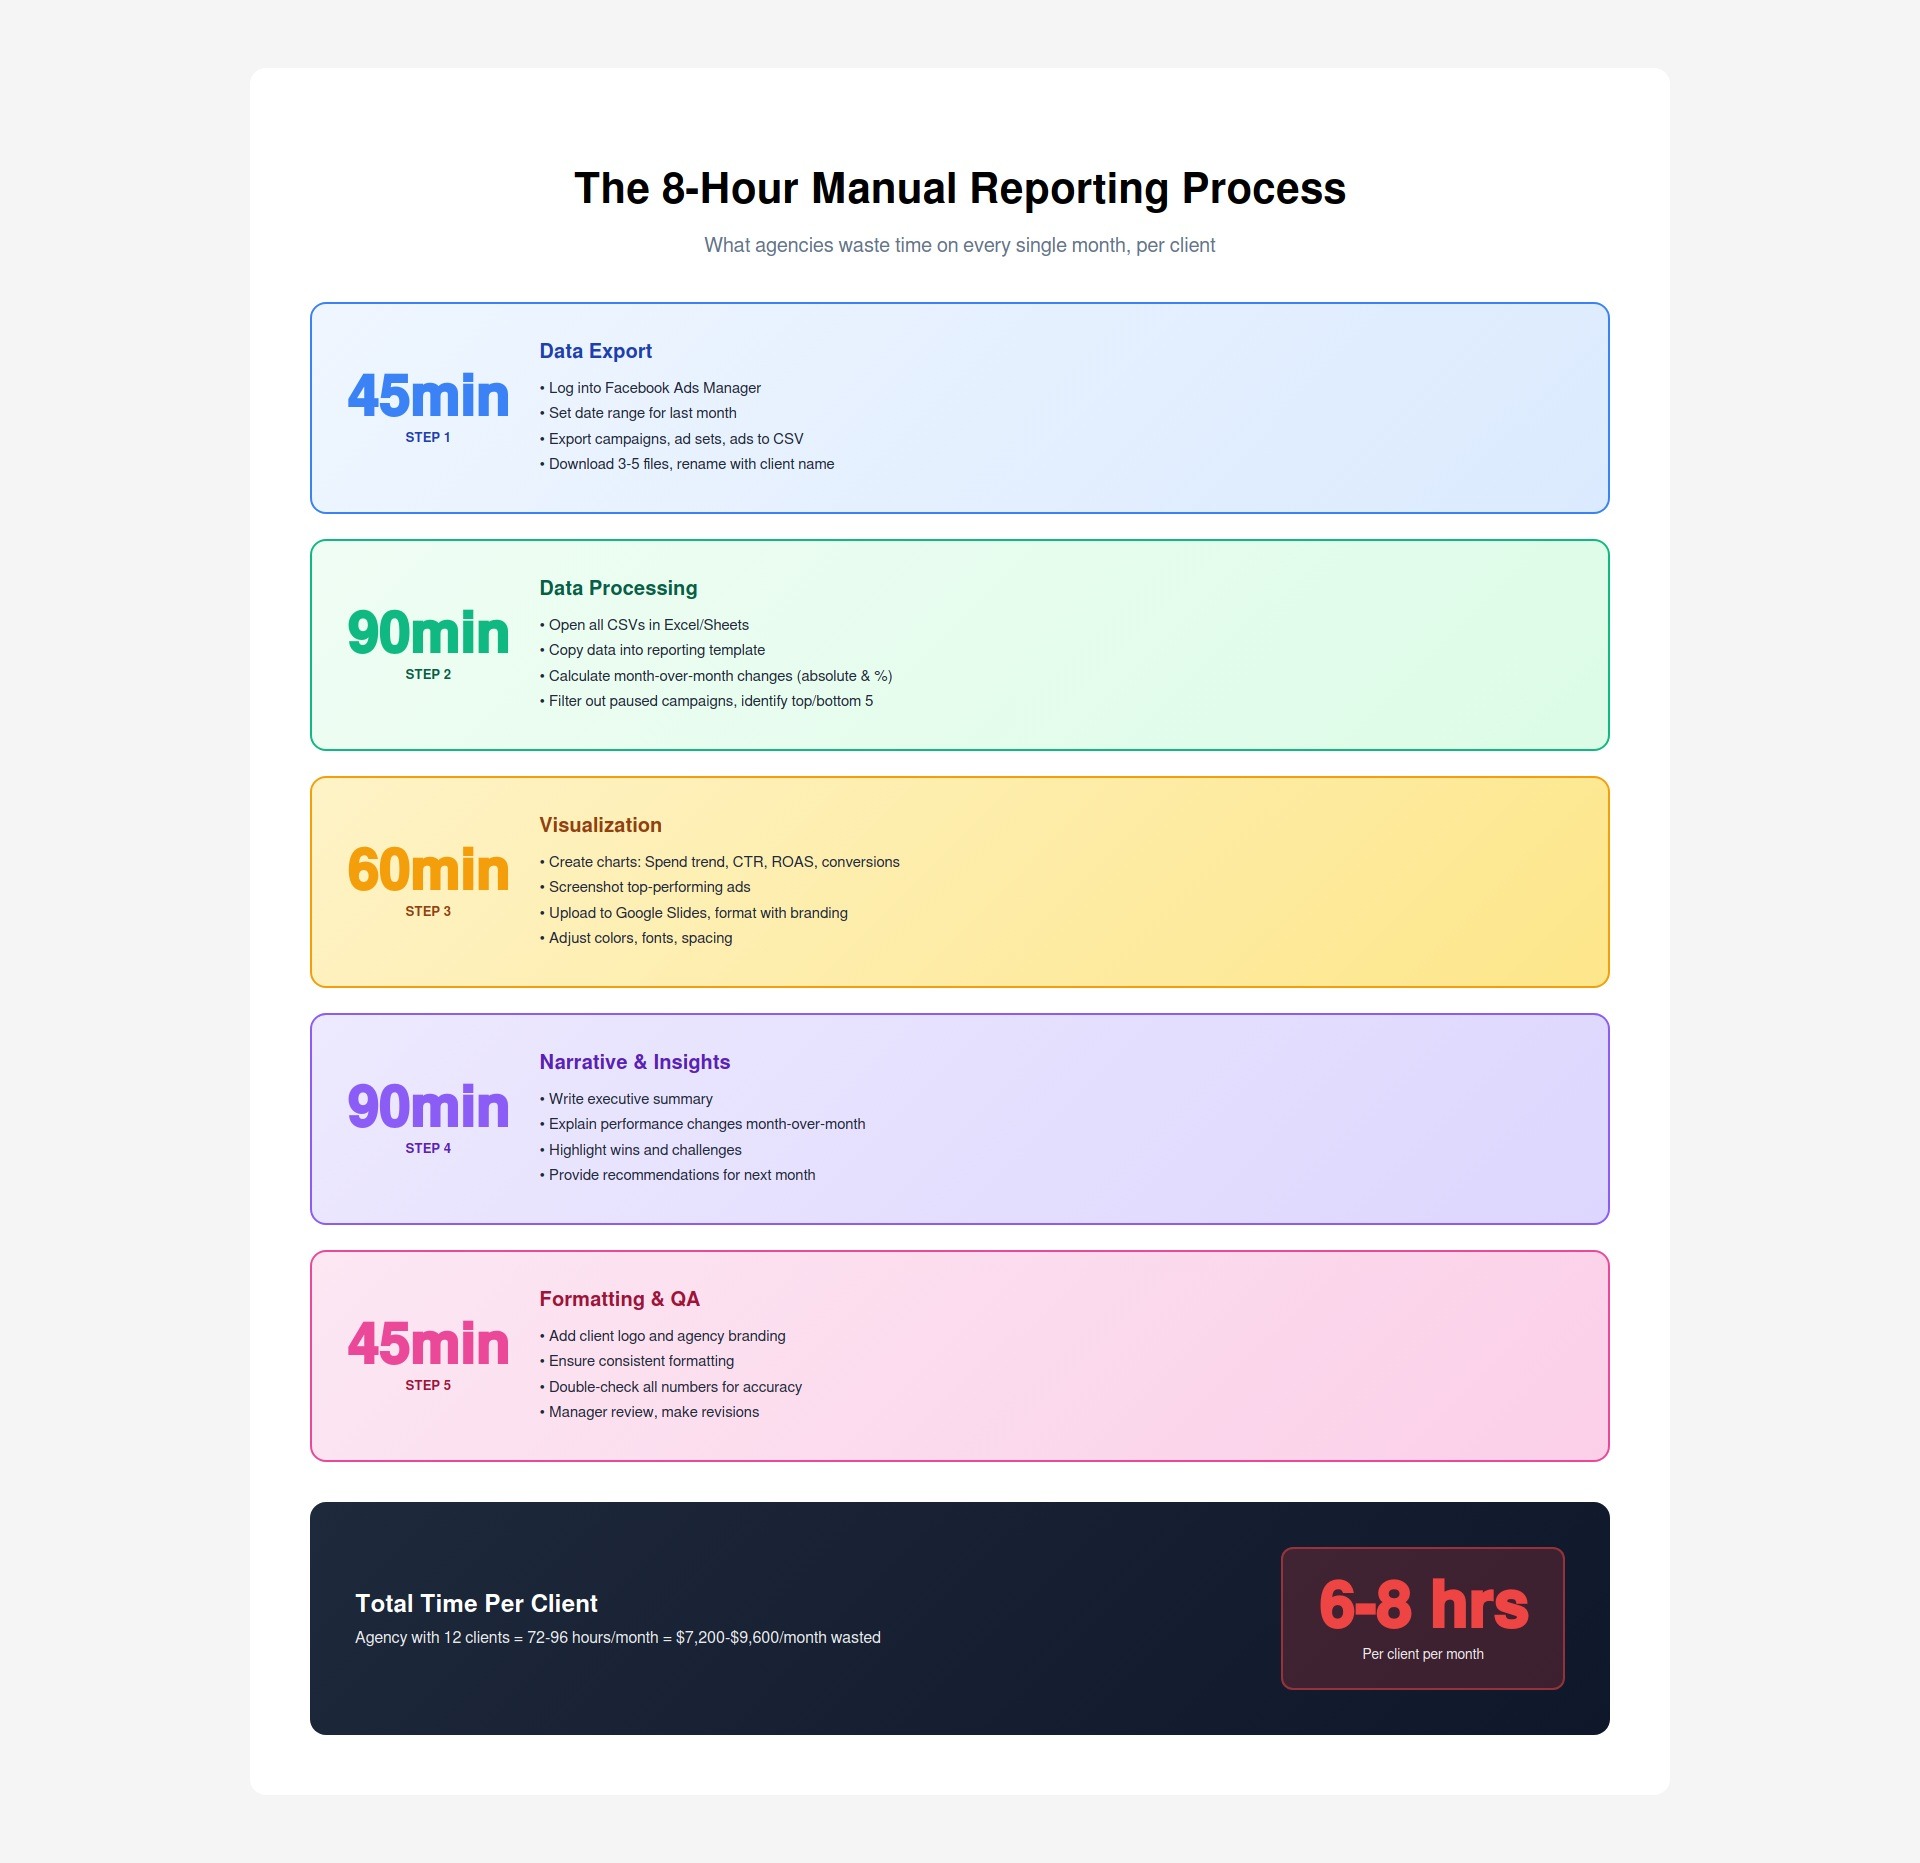
For each client, every month:
Step 1: Data Export (45 minutes)
Step 2: Data Processing (90 minutes)
Step 3: Visualization (60 minutes)
Step 4: Narrative & Insights (90 minutes)
Step 5: Formatting & QA (45 minutes)
Total time per client: 5-8 hours
Scenario: Connecticut digital agency
Monthly reporting time:
Annual cost:
What could you do with those 864 hours instead?
Beyond direct time costs:
1. Opportunity cost: Your best account managers hate manual reporting. It's boring, low-leverage work. They leave for agencies that use automation.
2. Human error: Copy-paste mistakes happen. Wrong numbers in client reports damage trust and look unprofessional.
3. Inconsistency: Different account managers format reports differently. Client experience varies based on who handles their account.
4. Delayed delivery: Reports are due by the 5th of the month. Account managers scramble to finish 12 reports between the 1st-5th. Clients get rushed reports with minimal insights.
5. No time for actual insights: When you spend 6 hours on data entry, you have 30 minutes left for strategy. The report becomes a data dump instead of strategic analysis.
Automated reporting isn't "AI writes your reports." It's systematic automation of the 80% of work that's pure data manipulation.
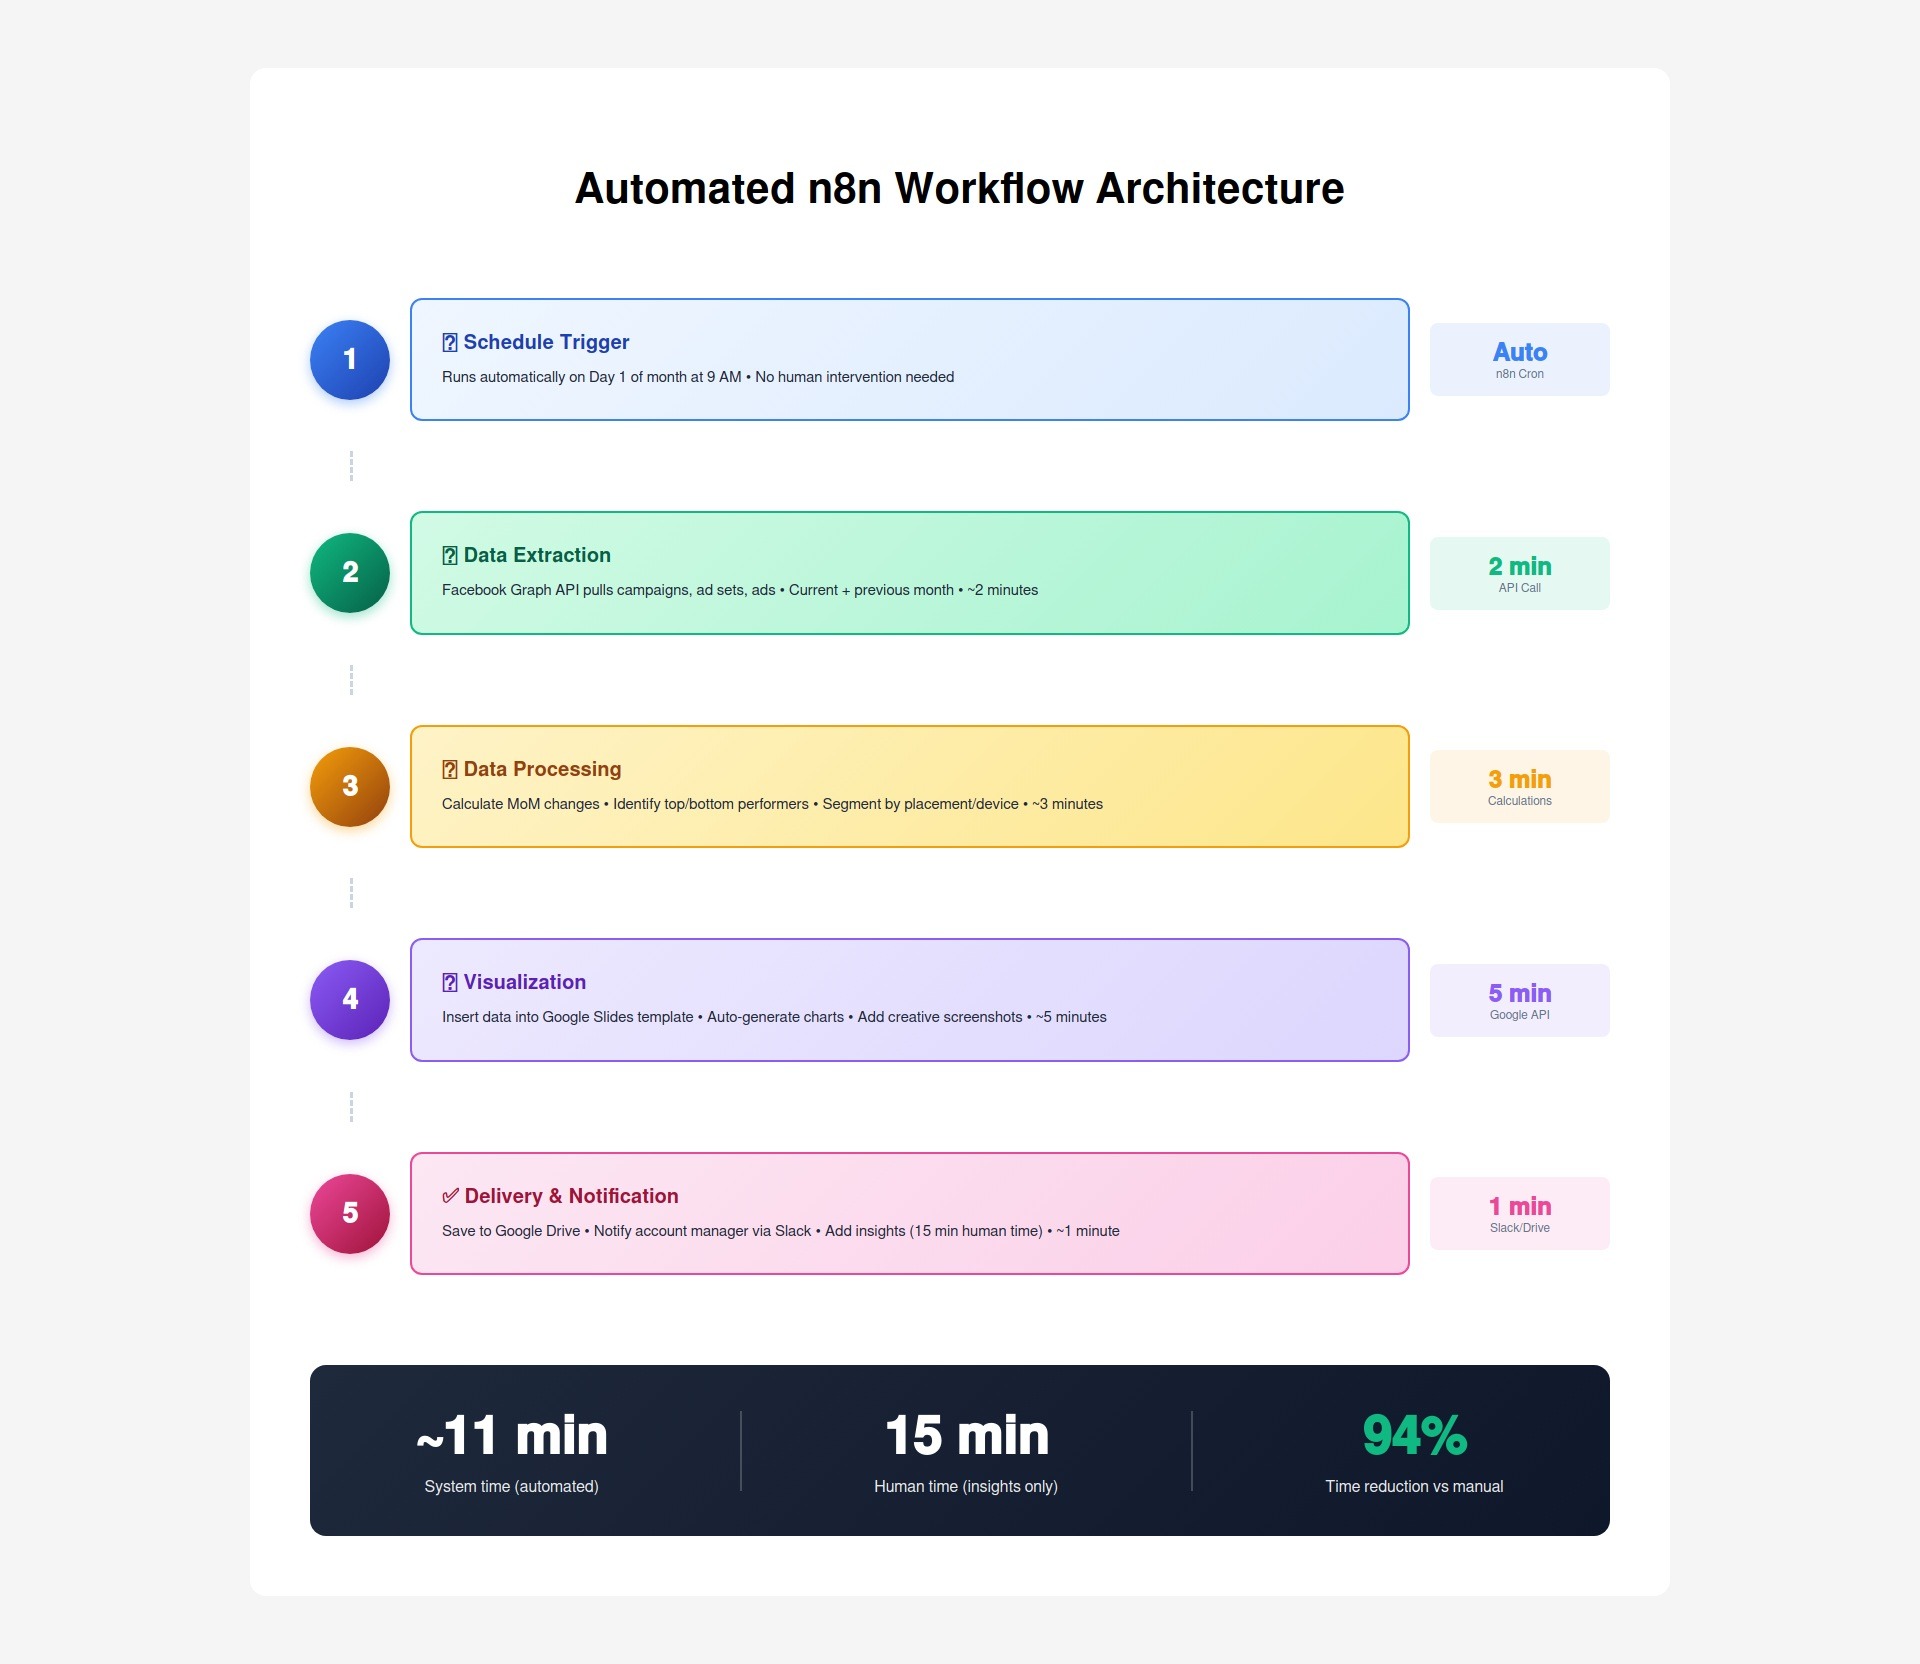
How it works:
Step 1: Scheduled trigger (Day 1 of month, 9 AM)
Step 2: Data extraction (2 minutes)
Step 3: Data processing (3 minutes)
Step 4: Visualization (5 minutes)
Step 5: Delivery (1 minute)
Total time: 15 minutes of human work (vs 6 hours manual)
Automated (no human needed):
Stays human (requires judgment):
The key: Automation handles 94% of time (data manipulation), humans handle 6% (strategy and insights).
Let me show you exactly how this works technically. This isn't theoretical—this is the actual system Connecticut agencies are running.
What is n8n?
Why n8n for this?
Workflow structure:
Authentication:
API calls made:
Call 1: Get campaigns
GET /v18.0/act_{ad_account_id}/campaigns
?fields=name,objective,status,spend,impressions,clicks,ctr,cpc,conversions,purchase_roas
&time_range={'since':'2024-11-01','until':'2024-11-30'}
&limit=1000
Call 2: Get ad sets
GET /v18.0/act_{ad_account_id}/adsets
?fields=name,campaign_name,optimization_goal,spend,impressions,clicks,ctr,conversions
&time_range={'since':'2024-11-01','until':'2024-11-30'}
&limit=1000
Call 3: Get ads with creatives
GET /v18.0/act_{ad_account_id}/ads
?fields=name,adset_name,creative{image_url,video_url,title,body},spend,impressions,clicks,ctr
&time_range={'since':'2024-11-01','until':'2024-11-30'}
&limit=1000
Call 4: Get previous month (for comparison) Same calls with time_range set to previous month.
Data returned:
Month-over-month calculations:
// Spend change
current_spend = 5240.32
previous_spend = 4680.15
spend_change = current_spend - previous_spend // +560.17
spend_change_pct = ((current_spend - previous_spend) / previous_spend) * 100 // +11.96%
// CTR change
current_ctr = 2.84
previous_ctr = 2.51
ctr_change = current_ctr - previous_ctr // +0.33
ctr_change_pct = ((current_ctr - previous_ctr) / previous_ctr) * 100 // +13.15%
Top/bottom performer identification:
// Sort campaigns by spend descending
campaigns_sorted = campaigns.sort((a, b) => b.spend - a.spend)
// Get top 5
top_5 = campaigns_sorted.slice(0, 5)
// Get bottom 5 (that have >100 impressions, exclude paused)
bottom_5 = campaigns_sorted
.filter(c => c.impressions > 100 && c.status == 'ACTIVE')
.slice(-5)
Segmentation by placement:
// Group by placement
instagram_spend = ads.filter(a => a.publisher_platform == 'instagram').reduce((sum, a) => sum + a.spend, 0)
facebook_spend = ads.filter(a => a.publisher_platform == 'facebook').reduce((sum, a) => sum + a.spend, 0)
audience_network_spend = ads.filter(a => a.publisher_platform == 'audience_network').reduce((sum, a) => sum + a.spend, 0)
Template structure:
Slide 1: Cover
Slide 2: Executive Summary
Slide 3: Month-over-Month Performance
Slide 4: Spend Trend Chart
Slide 5: Top 5 Performing Campaigns
Slide 6: Bottom 5 Campaigns
Slide 7: Placement Performance
Slide 8: Device Performance
Slide 9: Recommendations
Dynamic data insertion:
// n8n Google Slides node
// Replace {{TOTAL_SPEND}} placeholder with actual value
slides.replaceText('{{TOTAL_SPEND}}', `$${total_spend.toFixed(2)}`)
slides.replaceText('{{SPEND_CHANGE}}', `${spend_change_pct > 0 ? '+' : ''}${spend_change_pct.toFixed(1)}%`)
// Insert chart data
slides.updateChart('spend_trend_chart', {
labels: dates, // ['Nov 1', 'Nov 2', ..., 'Nov 30']
data: daily_spend // [245.32, 312.18, ..., 298.44]
})
// Insert image
slides.insertImage('top_creative_1', creative_image_url)
Once report is generated:
Action 1: Save to Google Drive
Action 2: Notify account manager via Slack
📊 Meta Ads Report Ready!
Client: Acme Corp
Month: November 2024
Status: ✅ Data populated, awaiting insights
Action needed: Add strategy commentary to Slides 2 & 9
Time estimate: 15 minutes
View report: [Link to Google Slides]
Action 3: Set reminder
Name: Redacted (Connecticut-based)
Team: 8 people (2 founders, 3 account managers, 2 designers, 1 ads specialist)
Clients: 12 Meta Ads clients
Annual revenue: $1.2M
Reporting process:
Pain points:
1. Burnout: Account managers dreaded the first week of every month. They spent 2-3 full days just copying data into slide decks.
2. Late delivery: Reports were supposed to go out by the 5th. They typically went out on the 7th-10th because of backlog.
3. Rushed insights: Account managers spent so much time on data entry that commentary was an afterthought. Reports were data dumps without strategic value.
4. Inconsistent quality: Each account manager formatted reports differently. Some clients got beautiful reports, others got basic ones, depending on who handled their account.
5. Retention risk: The best account manager quit in March 2024. Exit interview: "I didn't go to marketing school to copy-paste numbers into Excel for 30% of my job."
Week 1: Template standardization
Week 2: n8n workflow build
Week 3: Data processing logic
Week 4: Google Slides integration
Week 5: Testing & refinement
Week 6: Full rollout
Total implementation cost:
Monthly hosting cost:
Time savings:
Before:
After:
Reduction: 72-96 hours → 3 hours (94-97% reduction)
Cost savings:
Quality improvements:
1. Consistency: All 12 clients now get identical report formatting. Professional, branded, consistent.
2. Accuracy: Zero copy-paste errors in 6 months. Previously: 2-3 errors per month required corrections.
3. Delivery speed: Reports now sent on Day 2 of month (vs Day 7-10 before). Clients love getting reports faster.
4. Strategic depth: Account managers now spend 15 minutes on insights instead of 6 hours on data entry. Commentary quality improved dramatically.
5. Client satisfaction: Client NPS (Net Promoter Score) increased from 42 to 68 after automated reporting launch. Faster delivery + better insights = happier clients.
Team morale:
Account Manager #1: "I don't dread the first week of the month anymore. I actually look forward to it because I get to focus on strategy instead of Excel."
Account Manager #2: "This freed up 24 hours per month for me. I used that time to prospect and signed 2 new clients. We grew revenue instead of just maintaining it."
Founder: "This was a $6,200 investment that paid back in 6 weeks and now saves us $86K per year. We should have done this 2 years ago."
After seeing results with Meta Ads reporting, the agency automated:
Additional time savings: 40 hours/month
Total monthly reporting time: 96 hours → 8 hours (92% reduction)

You have three ways to get automated Meta Ads reporting.
Requirements:
Costs:
Pros:
Cons:
Best for: Agencies with in-house developers or technical founders
Options available:
Pros:
Cons:
Best for: Agencies that want plug-and-play solution and don't mind monthly fees
What we do:
Timeline: 2-3 weeks
Pricing:
What you get:
ROI calculation:
Best for: Agencies that want custom solution without building it themselves
Once you have the n8n infrastructure for Meta Ads reporting, you can automate other reporting too.
Same workflow structure:
Additional time saved: 6-8 hours per client per month
Monthly website performance:
Time saved: 2-3 hours per client per month
Automated SEO reports:
Time saved: 3-4 hours per client per month
Real-time dashboards:
Benefit: Clients feel more in control, reduce "how are my ads doing?" emails
Combined Meta + Google + Analytics:
Time saved: 15-20 hours per client per month
Connecticut agency example:
Before automation:
After automation:
Reduction: 19 hours → 0.5 hours (97% reduction)
For an agency with 12 clients:
If you're spending 70+ hours per month on manual Meta Ads reporting, here's what happens next:
We analyze your current reporting process:
Output: Detailed breakdown of your reporting costs and automation opportunity.
Week 1: Template & workflow design
Week 2: Build & test
Week 3: Rollout
Week 4: Optimization
Option A: Full automation setup
Option B: Ownership model
You're a good fit if:
You're NOT a fit if:
Email: renzo@rdcgroup.co
Phone: (860) 968-0135
Website: rdcgroup.co
Book audit: calendly.com/renzo-consulting/rdcg-client
The problem: Your account managers spend 6-8 hours per month per client copying Facebook data into slide decks.
The cost: At 12 clients, that's 72-96 hours/month = $7,200-$9,600/month = $86,400-$115,200/year.
The solution: Automated n8n workflow that extracts data, calculates metrics, generates charts, and populates Google Slides templates.
The result: 8 hours → 15 minutes per client (94% time reduction).
Stamford agency results:
The choice is yours:
Option A: Keep copying-and-pasting data for 72-96 hours per month
Option B: Automate it once, free up 96 hours/month for strategy and growth
The difference is a $4,500 investment that pays back in 3-4 weeks.
Ready to stop wasting time on manual reporting?
Book your free reporting audit →
We'll analyze your current process, calculate your exact costs, and show you how automation would work for your Connecticut agency.
No commitment. No sales pitch. Just a free analysis of your reporting automation opportunity.